Storefront audit against the measured best practice

Every screen here answers a reason people leave without buying.

Evidence

They fill the cart, reach the checkout, see a delivery charge they were not expecting, and close the tab.

Product page · desktop, 1440 pxProduct page · phone, 390 px

northboundsupply.example/products/tyne-merino-beanie
121

Click the screen to look closer — it opens at full size at the point you pressed

What the store does

  • The price carries its condition on the same screen: £28.00 · UK delivery £4.99, free over £50 · dispatched within two working days.
  • The free-delivery threshold sits in the bar above the header, on every page of the shop.
  • The return window is next to the buy button, not on a policy page: 30 days to send it back, unworn, with the tags on.
40%

of shoppers name extra costs — delivery, tax, fees — as a reason they abandoned an order.

Baymard Institute, survey of US adults · source

Buyer survey
64% / 43%

look for the delivery cost on the product page before adding to the cart; 43% of sites do not show it there.

Baymard Institute, benchmark of 155+ leading sites
The photos are fine. People still write in asking what it actually looks like.

Product page, gallery · desktop, 1440 pxProduct page, gallery · phone, 390 px

northboundsupply.example/products/tyne-merino-beanie
11

Click the screen to look closer — it opens at full size at the point you pressed

What the store does

  • Seven frames per product, zoom on each, and one frame that shows the thing at scale.
  • Every frame has its own caption saying what it shows — the fabric, the cuff, the size against a hand.
  • On a phone the gallery comes before the description, because that is the order people read in.
56%

of users look at the photographs first — before the price, the description and the reviews. 25% of sites do not let them examine the product: 14% low resolution, 11% no zoom.

Baymard Institute, usability tests and benchmark of 155+ sites · source

Site benchmark
42% / 37%

try to judge the physical size from the photographs; 37% of sites give no frame with the product at scale, 23% none with a person.

Baymard Institute, 30,000+ rated elements

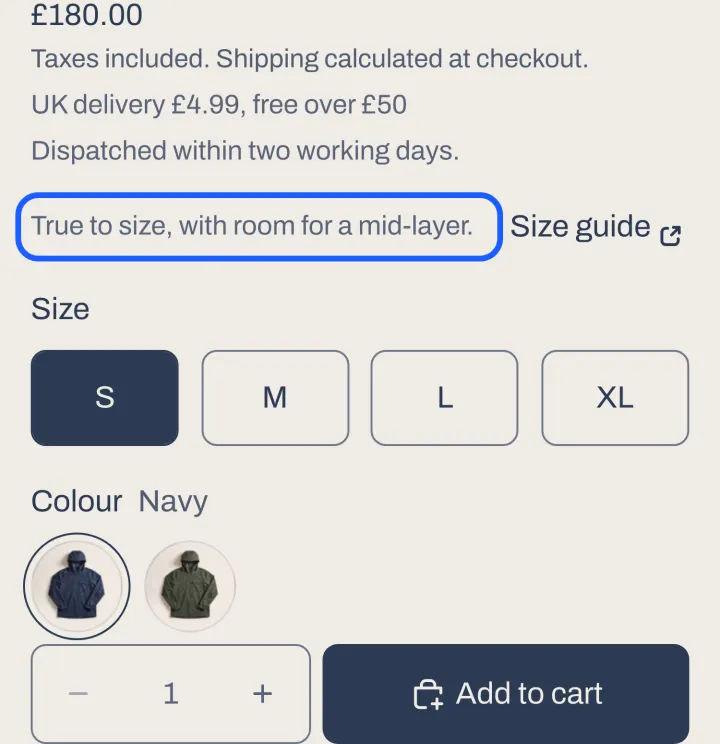
Returns eat the margin. It is almost always ‘did not fit’.

Product page · phone, 390 px

northboundsupply.example/products/northbound-3l-anorak

Click the screen to look closer — it opens at full size at the point you pressed

What the store does

  • One line of fit guidance above the size buttons: true to size, with room for a mid-layer.
  • The size guide opens from next to the size, not from the footer.
  • Reviews carry the reviewer’s height and the size they took, so the next person can compare.
−4.3% / +11.1%

size returns in textiles after a “runs small” note — and, the other way, 11.1% more orders of the same item in two sizes. Both effects are real and pull in opposite directions.

Zalando, live A/B, 720,000 shoppers per arm, reviewed at SIGKDD ’21 · source

Live A/B test
+2.1%

conversion from a personal size recommendation, and +1.8% add-to-cart — a separate pair of Zalando experiments, which found no significant drop in size returns. That is the honest half of the result.

Zalando, two live A/B tests, 300,000+ shoppers per arm

Twenty-seven reviews on that product and they sit at the bottom of the page, under a tab.

Collection · desktop, 1440 pxCollection · phone, 390 px

northboundsupply.example/collections/all-northbound
11

Click the screen to look closer — it opens at full size at the point you pressed

What the store does

  • Rating and review count sit under the product name — and on every tile in the list.
  • The reviews themselves are on the page, not behind a tab and not folded into a “what people say” summary.
  • The count is printed as a number, because the number is what carries the weight.
0.104 → −0.004

is how the link between reviews and sales collapses once the shopper has to scroll to reach them (b = −0.054, p < 0.05). Summaries of “typical good / typical bad” went with lower sales, not higher.

Meta-regression of 1,532 effect sizes from 96 studies, 40 platforms. Journal of Marketing Research 53(3), 2016 · source

Academic review
0.360 vs 0.075

the number of reviews relates to sales roughly five times as strongly as the average rating does.

The same meta-regression

Traffic is fine. They just do not seem to find anything.

Collection · desktop, 1440 pxCollection · phone, 390 px

northboundsupply.example/collections/all-northbound
121

Click the screen to look closer — it opens at full size at the point you pressed

What the store does

  • All five must-have filter types — availability, price, colour, size, material — and every applied one shows as a chip you can take off.
  • The count is stated: 5 items. Sorting is named in words, not in “recommended”.
  • Search sits in the header, and it narrows the collection rather than throwing the shopper onto a separate results page.
78% / 51%

of stores on mobile have poor or mediocre list and filtering; 51% do not offer all five must-have filter types.

Baymard Institute, 170+ leading sites, 21,000+ rated parameters, 2024–2025 · source

Site benchmark
24% → 44%

shoppers who use search are 24% of visitors but 44% of revenue. Careful: that is a comparison of two groups, not proof that search caused the sale.

Constructor, 609M queries, $9.8bn revenue, 113 sites, Q4 2024 — a vendor, sample disclosed

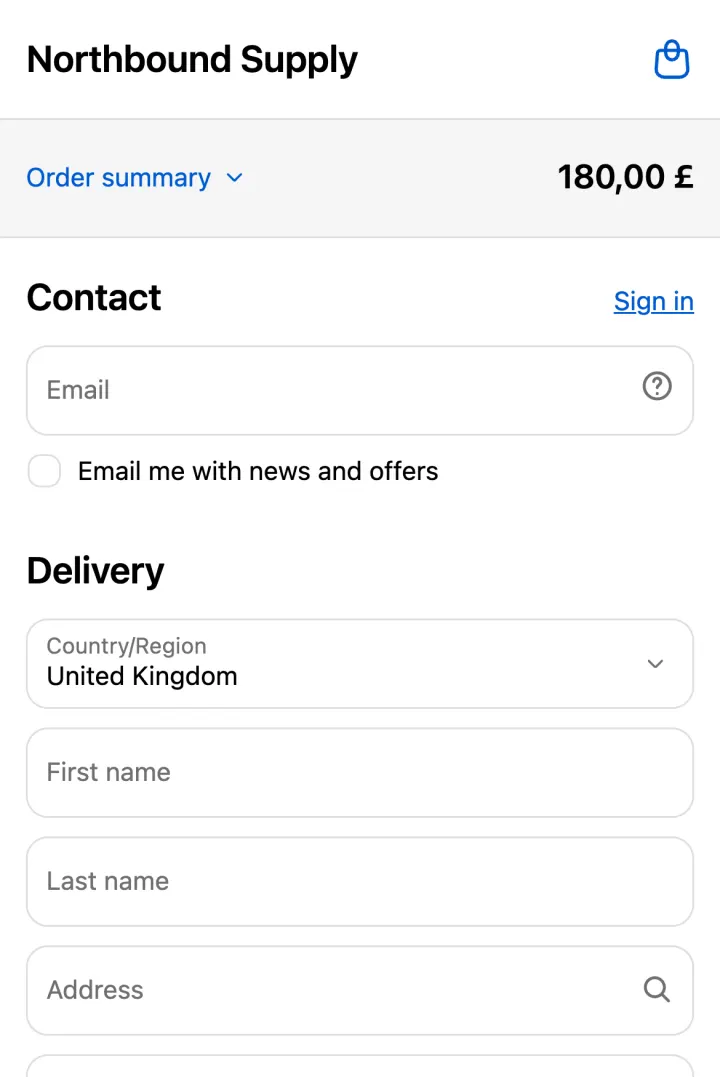
They get all the way to the checkout and then we ask them to register.

Checkout, first step · phone, 390 px

northboundsupply.example/checkouts/…
1

Click the screen to look closer — it opens at full size at the point you pressed

What the store does

  • Checkout is guest by default. Signing in is a link in the corner, not a step you must pass.
  • Contact is one field — the email. The account offer comes after the money, not before it.
  • The form is nine elements where the average US checkout has twenty-three.
24%

of US adults abandoned at least one cart in a quarter solely because the store required them to create an account.

Baymard Institute, survey of 4,384 US adults, 2022 · source

Buyer survey
23.48 → 12–14

form elements in the average US checkout, against the 12–14 that are enough. Every field you delete is a field nobody can mistype.

Baymard Institute, checkout benchmark of leading US sites

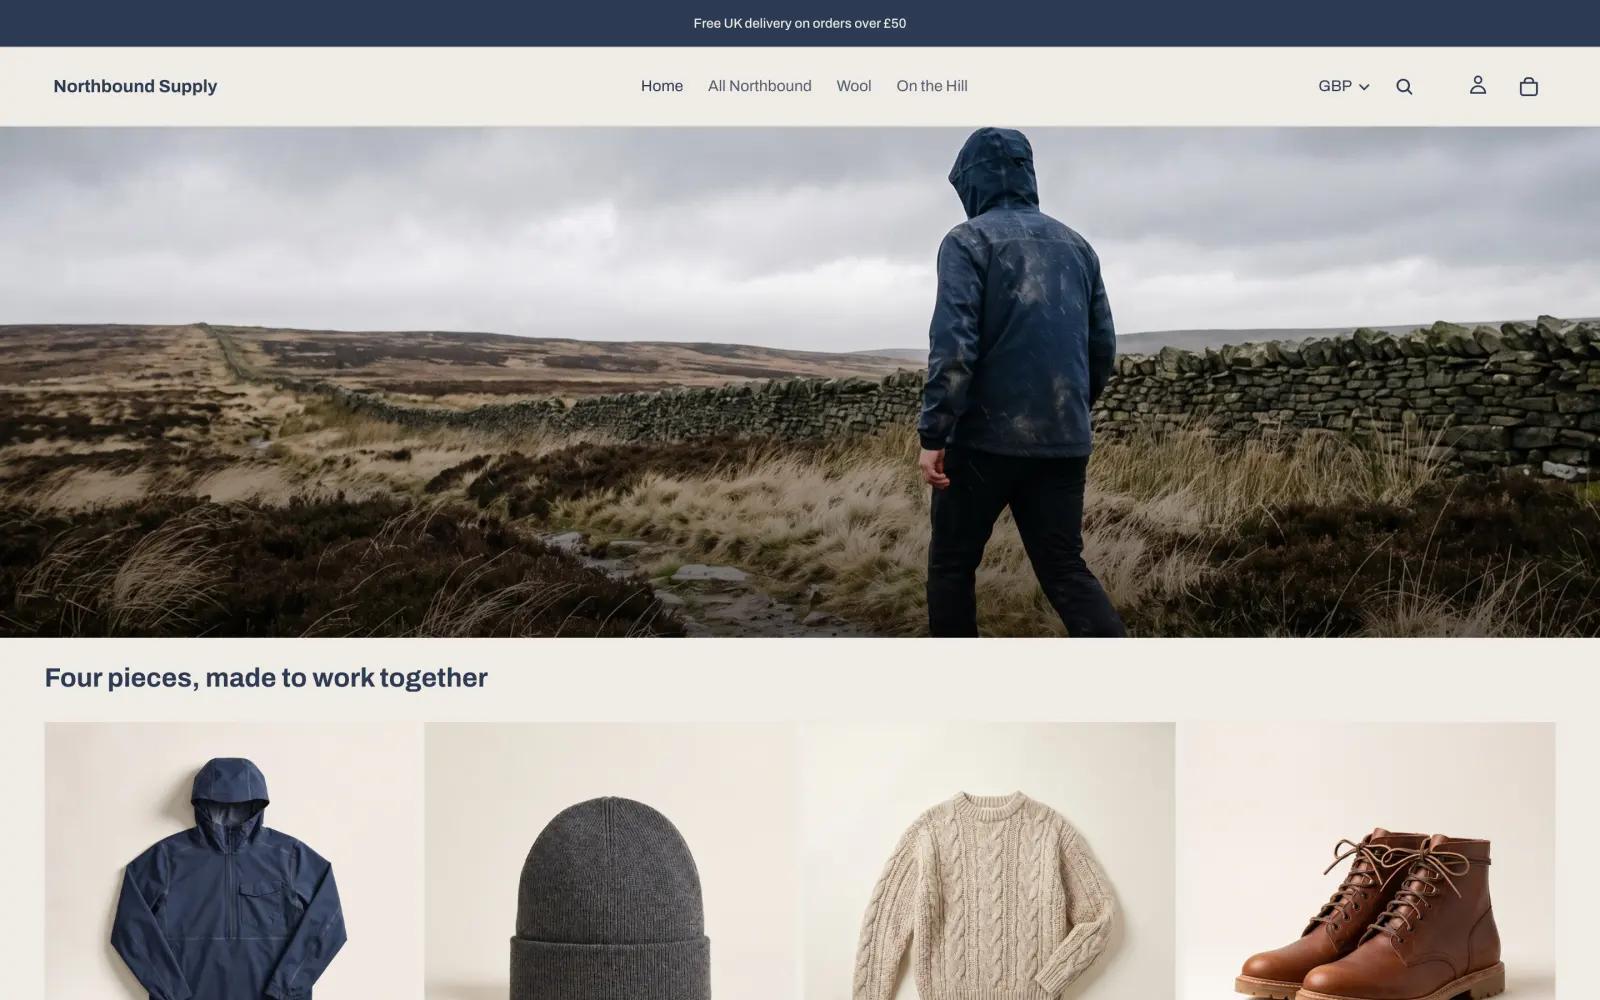
We ship to Ireland and Germany. They see pounds and a UK delivery promise.

Home · desktop, 1440 px

northboundsupply.example
12

Click the screen to look closer — it opens at full size at the point you pressed

What the store does

  • Market and currency are picked up automatically, shown in the header and changeable in one click.
  • Switching the market recalculates the prices, the delivery cost and the delivery dates — not just the symbol in front of the number.
  • The payment methods follow the market, because the ones people trust differ by country.
+4.7%

conversion from showing the price in the buyer’s own currency; payment authorisation +1.9%, value per session +5.4%.

Stripe, 1.5M sessions, randomised 1% holdback, March 2026 · source

Live A/B test
+46% / +39% / +47%

from the local payment method: BLIK in Poland, iDEAL in the Netherlands, PayPal in Germany. Same holdback experiment.

Stripe — a vendor that charges for currency conversion, so read it with that in mind; the design is disclosed

The agency put an email popup on entry. It collects addresses. Is it costing us buyers?

Home, first screen · desktop, 1440 pxHome, first screen · phone, 390 px

northboundsupply.example

Click the screen to look closer — it opens at full size at the point you pressed

What the store does

  • Nothing covers the first screen. No overlay on load, at any width.
  • The newsletter lives in the footer, where someone who liked the shop will find it.
  • The one thing that gets a permanent bar at the top is the delivery promise, because that is the objection people actually leave over.
40%

of stores show an overlay when you arrive. In usability tests shoppers dismissed it reflexively, without reading it, and were annoyed all the same.

Baymard Institute, tests on 19 stores and a benchmark of 50 large sites · source

No measurement
No number

nobody has published what removing the entry popup does to conversion, and we are not going to invent one. This screen is built on the test finding above, not on a lift.

Stated as an absence on purpose

Everyone says the site is slow. Nobody tells me what that costs in money.

Under the hood · what a browser measures

what the platform measures, and where the line is
The three thresholds a browser reports, at the 75th percentile
LCP
2.5 s
Largest Contentful Paint — when the main thing on the screen has finished drawing
INP
200 ms
Interaction to Next Paint — how long the page takes to answer a tap
CLS
0.1
Cumulative Layout Shift — how much the page moves under the reader

Unchanged since 2024, and there is no new metric after INP — Google / web.dev, updated 07.05.2025.

What the store does

  • The largest image on the first screen is loaded eagerly and at high priority, so the thing that defines the score is not queued behind a script.
  • The page is rendered by the theme, not assembled in the browser after the fact.
  • Reviews and analytics load after the first paint, never before it.
−3.5%

conversion for every extra 100 ms of LCP, and −1.5% for every extra 32 ms of INP. For CLS the same study found no relation at all.

Shopify, every actively selling store on the platform, 28-day window, early 2026 — vendor, method disclosed, correlation and not causation · source

Vendor document
2.5 s / 200 ms / 0.1

the thresholds themselves, at the 75th percentile. They have not moved since 2024, and there is no new metric after INP.

Google / web.dev, page updated 07.05.2025

The dashboard says 2.1%. Two point one per cent of what, exactly?

Under the hood · the four splits

one number, four splits
The four splits the platform’s own guidance asks for
By device1.9% / 3.4%phone against desktop; about seven visits in ten arrive on a phone
New / returning1.7% / 2.9%Contentsquare, 99 billion sessions, Q4 2025
By sourcesearch / email / paiduntil the sources are separated, every advertising decision is blind
By price bandunder £50 / £150+an expensive item converts worse by nature, not because the page is bad

What the store does

  • Conversion is split by device, by source, by new against returning and by price band — the four the platform’s own guidance asks for.
  • Phone and desktop are never averaged: seven visits in ten come from a phone and they behave differently.
  • Each split is a column in the panel we build, not a request you have to file.
1.7% vs 2.9%

new visitors against returning ones. Mobile is 69.9% of traffic while desktop converts 74% higher — an average of the two describes nobody.

Contentsquare, 99 billion sessions, 6,000+ sites, Q4 2025 · source

Traffic at scale
Fewer than half

of merchants measure margin, traffic, average order value or conversion at all — a survey the platform itself quotes.

Shopify, survey of store owners, Q4 2025

My customers ask ChatGPT what to buy. Am I in there, or is my competitor?

Selling inside AI · the four channels

four channels, and where the buyer pays
Four channels, and where the buyer pays
ChatGPTIn your storethe checkout opens in an in-app browser — your analytics, your payment methods
Google AI Mode, GeminiIn the channelneeds the Google & YouTube channel; product search runs through Merchant Center
Microsoft CopilotIn the channelShopify stores are connected automatically, with a window to opt out
MetaIn the channelneeds the Meta channel with product sync; became an AI channel on 08.09.2026

What the store does

  • Four channels read a Shopify catalogue: ChatGPT, Google AI Mode and Gemini, Microsoft Copilot, Meta.
  • In ChatGPT the payment happens in your own checkout, opened in an in-app browser: your analytics, your payment methods.
  • No subscription and no channel commission — the wording is «you pay only your standard payment processing fees», repeated on all four help pages.
US sales

switch the channels on: each of the four states «You must sell to customers in the United States». The store itself may sit anywhere in the world. Selling to the US is the one condition we set up around; the rest is plan, policies, two-factor and a real trading history.

Shopify, help page of each of the four channels · source

Vendor document
+393% / +42%

AI traffic to US retail sites over a year, and that traffic converting 42% better in March 2026 than a year earlier.

Adobe Analytics, 1+ trillion visits — the period and the denominator are disclosed, the definition of an «AI source» is not

If the assistant picks one shop out of three, what is it picking on?

Selling inside AI · the card an agent gets

what the assistant reads before it picks
What the agent gets back — a mock-up built from our own catalogue

The shopper asks“A warm beanie that fits under a hood, under £40, delivered to the UK this week”

Tyne Merino Beanie · £28.00
4.5 ★ · 27 reviews · 100% merino, fine rib, 90 g · one size, fits 54–60 cm · UK delivery £4.99, free over £50 · 30-day returns

Every line in that card is a field the admin scores: description completeness, image coverage, reviews, variants, policies.

What the store does

  • The catalogue is built from the product fields themselves: title, description, images, category, variants, options, price and stock.
  • Facts rather than adjectives — material, size, weight, care, compatibility: the fields an agent can actually read and compare.
  • A taxonomy category on every product, plus barcode and brand; for the Google channel the brand is required.
7 fields

are what the catalogue works from — title, description, images, category, variants, price and availability. In the vendor’s words: «the higher quality your titles, descriptions, categories, variants, and images, the better information Shopify has to work with».

Shopify, Shopify Catalog listing quality · source

Vendor document
3 policies

terms, privacy and returns have to be filled in, or the channel does not connect at all.

Shopify, channel requirements

Is there anywhere I can tell an AI how my shop actually works?

Selling inside AI · the file you write to an agent

/agents.md · /llms.txt · /llms-full.txt
The file the merchant writes to an agent
GET northboundsupply.example/agents.md # Northbound Supply Delivery: UK £4.99, free over £50, dispatched in two working days. Returns: 30 days, unworn, with the tags on. Sizing: true to size; the anorak has room for a mid-layer. Stock: what the catalogue says is what is on the shelf.

Served automatically on every store, overridden by theme templates — Shopify, agents.md documentation.

What the store does

  • Every Shopify store serves /agents.md, /llms.txt and /llms-full.txt automatically — no app needed — and the theme can override them.
  • That is the one place a merchant speaks to an agent in his own words: delivery, returns, sizing, what is really in stock.
  • We read what the store hands an agent today, and fix what the agent cannot see.
By default

«Shopify manages an agents.md file by default for every store». The default already carries the store’s policies, its browsing endpoints and guidance for shopping agents; /llms.txt and /llms-full.txt mirror it unless you give them their own template.

Shopify, agents.md.liquid template reference · source

Vendor document
Read, not guessed

we asked our own store the way an agent does and recorded what came back: the catalogue endpoint answers without authentication.

Our own measurement, September 2026

How to read the numbers on this page

A survey is not a conversion lift

“24% abandoned a cart because of a forced account” is what people said about themselves. It sizes the problem. It is not a promise that removing the account wall adds 24%.

Baymard does not publish conversion lifts at all

They measure the share of sites that get an element wrong and the share of shoppers who name a reason. Anyone quoting “Baymard: +12% conversion” at you is quoting something that does not exist.

Where the measurement is missing, it is missing

Sticky buy buttons, address autocomplete, guest checkout as an experiment, product-photo counts: nobody has published a conversion number. We build them on reasoning, and we say which is which.

Your shop, the same way: one screen at a time.

The first step is a free check of your public storefront — two working days, a written note with the numbers in it. No access to the admin, nothing installed. The note stays with you either way.

Get a free check